
Basic Information
Authors EKIM YURTSEVER, JACOB LAMBERT, ALEXANDER CARBALLO, AND KAZUYA TAKEDA
Organization Graduate School of Informatics, Nagoya University, Nagoya 464-8603, Japan Tier IV Inc., Nagoya 113-0033, Japan
Source IEEE access journal
Content
Intorduction
According to a recent technical report by the National Highway Traffic Safety Administration (NHTSA), 94% of road accidents are caused by human errors. Against this backdrop, Automated Driving Systems (ADSs) are being developed with the promise of preventing accidents, reducing emissions, transporting the mobility-impaired and reducing driving related stress. If widespread deployment can be realized, annual social benefits of ADSs are projected to reach nearly $800 billion by 2050 through congestion mitigation, road casualty reduction, decreased energy consumption and increased productivity caused by the reallocation of driving time.
The Society of Automotive Engineers (SAE) refers to hardware-software systems that can execute dynamic driving tasks (DDT) on a sustainable basis as ADS
Prospects and challenges
Social impact
- Solving problems: preventing traffic accidents, mitigating traffic congestions, reducing emissions
- Arising opportunities: reallocation of driving time, transporting the mobility impaired
- New trends: consuming Mobility as a Service (MaaS), logistics revolution
Challenges
ADSs are complicated robotic systems that operate in indeterministic environments. As such, there are myriad scenarios with unsolved issues.
The Society of Automotive Engineers (SAE) defined five levels of driving automation.
- Level zero stands for no automation at all.
- Level one: Primitive driver assistance systems such as adaptive cruise control, anti-lock braking systems and stability control.
- level two: partial automation to which advanced assistance systems such as emergency braking or collision avoidance are integrated. The real challenge starts above this level.
- Level three is conditional automation; the driver could focus on tasks other than driving during normal operation, however, s/he has to quickly respond to an emergency alert from the vehicle and be ready to take over. In addition, level three ADS operate only in limited operational design domains (ODDs) such as highways
- Level four: Human attention is not needed in any degree at level four and five. However, level four can only operate in limited ODDs where special infrastructure or detailed maps exist.
Level four and above driving automation in urban road networks is an open and challenging problem.
System components and architecture
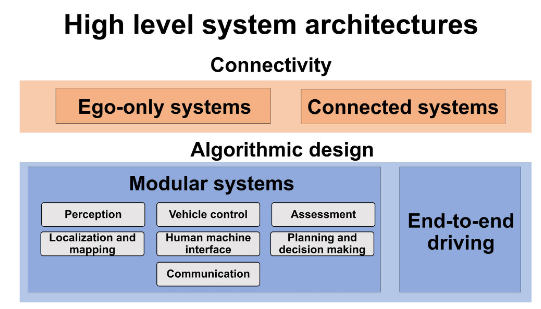
Figure 1. A high level classification of automated driving system architectures.
ADSs are designed either as standalone, ego-only systems or connected multi-agent systems. Furthermore, these design philosophies are realized with two alternative approaches: modular or endto-end driving.
Ego-only systems
The ego-only approach is to carry all of the necessary automated driving operations on a single self-sufficient vehicle at all times, whereas a connected ADS may or may not depend on other vehicles and infrastructure elements given the situation.
modular systems
Modular systems, referred as the mediated approach in some works, are structured as a pipeline of separate components linking sensory inputs to actuator outputs. Core functions of a modular ADS can be summarized as: localization and mapping, perception, assessment, planning and decision making, vehicle control, and human-machine interface.
The major disadvantages of modular systems are being prone to error propagation and over-complexity. For example, in the unfortunate Tesla accident, an error in the perception module in the form of a misclassification of a white trailer as sky, propagated down the pipeline until failure, causing the first ADS related fatality
End-to-end driving
End-to-end driving, referred as direct perception in some studies, generate ego-motion directly from sensory inputs.There are three main approaches for end-to-end driving: direct supervised deep learning, neuroevolution and the more recent deep reinforcement learning.
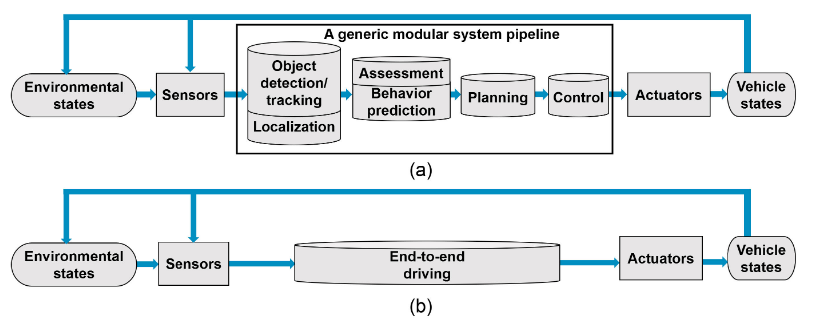
Figure 2. Information flow diagrams of: (a) a generic modular system, and (b) an end-to-end driving system.
| Related works | Learning/training strategy | Pros/cons |
|---|---|---|
| Direct supervised deep learning | imitates the target data. Can be trained offline. Poor generalization performance | |
| Deep reinforcement learning | Learning the optimum way of driving. Require online interaction. Urban driving has not been achieved yet | |
| Neuroevolution | No backpropagation. Requires online interaction. Real world driving has not been achieved yet. |
Table 1. Common end-to-end driving approaches.
End-to-end driving is promising, however it has not been implemented in real-world urban scenes yet, except limited demonstrations. The biggest shortcomings of end-to-end driving in general are the lack of hard coded safety measures and interpretability
Connected systems
V2X is a term that stands for ‘‘vehicle to everything.’’ From mobile devices of pedestrians to stationary sensors on a traffic light, an immense amount of data can be accessed by the vehicle with V2X
By sharing detailed information of the traffic network amongst peers, shortcomings of the ego-only platforms such as sensing range, blind spots, and computational limits may be eliminated.However, without reducing huge amounts of continuous driving data, sharing information between hundreds of thousand vehicles in a city could not become feasible. A semiotic framework that integrates different sources of information and converts raw sensor data into meaningful descriptions.
localization and mapping
Localization is the task of finding ego-position relative to a reference frame in an environment, and it is fundamental to any mobile robot. There are three common approaches: Global Positioning System and Inertial Measurement Unit (GPS-IMU) fusion, Simultaneous Localization And Mapping (SLAM), and state-of-the-art a priori map-based localization. A comparison of localization methods is given in Table 2.
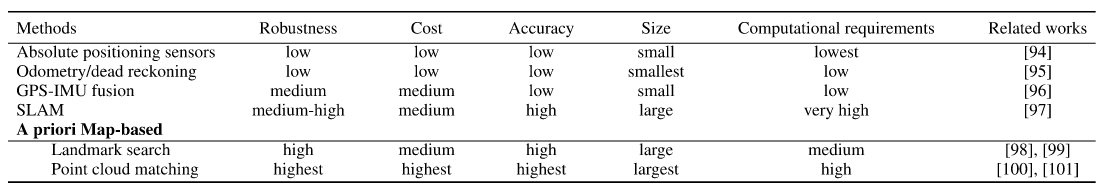
Table 2. Localization techniques.
GPS-IMU fusion
The main principle of GPS-IMU fusion is correcting accumulated errors of dead reckoning in intervals with absolute position readings. GPS-IMU systems by themselves cannot be used for vehicle localization as they do not meet the performance criteria. But they are used for initial pose estimation in tandem with lidar and other sensors in state-ofthe-art localization systems.
Simultaneous Localization And Mapping
SLAM is the act of online map making and localizing the vehicle in it at the same time. However, due to the high computational requirements and environmental challenges, running SLAM algorithms outdoors, which is the operational domain of ADSs, is less efficient than localization with a pre-built map.
SLAM techniques have one major advantage over a priori methods: they can work anywhere.
A Priori Map-based Localization
The core idea of a priori map-based localization techniques is matching: localization is achieved through the comparison of online readings to the information on a detailed pre-built map and finding the location of the best possible match.
There are two different map-based approaches; landmark search and matching.
landmark search
Landmark search is computationally less expensive in comparison to point cloud matching. It is a robust localization technique as long as a sufficient amount of landmarks exists. In an urban environment, poles, curbs, signs and road markers can be used as landmarks.
A road marking detection method using lidar and Monte Carlo Localization (MCL). In this method, road markers and curbs were matched to a 3D map to find the location of the vehicle.
This approach has one major disadvantage; landmark dependency makes the system prone to fail where landmark amount is insufficient.
Point cloud matching
The state-of-the-art localization systems use multi-modal point cloud matching based approaches.
2D to 3D matching
Matching online 2D readings to a 3D a priori map is an emerging technology.This approach requires only a camera on the ADS equipped vehicle instead of the more expensive lidar. The a priori map still needs to be created with a lidar.
Perception
Perceiving the surrounding environment and extracting information which may be critical for safe navigation is a critical objective for ADS. A variety of tasks, using different sensing modalities, fall under the category of perception.
Detection
Image-based object detection
Object detection refers to identifying the location and size of objects of interest.
While state-of-the-art methods all rely on DCNNs, there currently exist a clear distinction between them:
- Single stage detection frameworks use a single network to produce object detection locations and class prediction simultaneously
- Region proposal detection frameworks use two distinct stages, where general regions of interest are first proposed, then categorized by separate classifier networks.
Region proposal methods are currently leading detection benchmarks, but at the cost requiring high computation power. Meanwhile, single stage detection algorithms tend to have fast inference time and low memory cost, which is well-suited for real-time driving automation. YOLO (You Only Look Once) is a popular single stage detector the full model operating at 45 FPS and a smaller model operating at 155 FPS for a small accuracy trade-off. Another widely used algorithm, even faster than YOLO, is the Single Shot Detector (SSD).However, region proposal networks (RPN) have proven to be unmatched in terms of object recognition and localization accuracy, and computational cost has improved greatly in recent years, which can replace single stage detection networks for ADS applications in the near future.
Omnidirectional and Event Camera-based Perception
360 degree vision, or at least panoramic vision, is necessary for higher levels of automation. Alternatively, omnidirectional cameras can be used, or a smaller array of cameras with very wide angle fisheye lenses.
These are however difficult to intrinsically calibrate; the spherical images are highly distorted and the camera model used must account for mirror reflections or fisheye lens distortions, depending on the camera model producing the panoramic images. The accuracy of the model and calibration dictates the quality of undistorted images produced, on which the aforementioned 2D vision algorithms are used.
Event cameras are a fairly new modality which output asynchronous events usually caused by movement in the observed scene.
Poor illumination and changing appearance
TODO
Semantic segmentation
Beyond image classification and object detection, computer vision research has also tackled the task of image segmentation. This consists of classifying each pixel of an image with a class label. This task is of particular importance to driving automation as some objects of interest are poorly defined by bounding boxes, in particular roads, traffic lines, sidewalks and buildings. A segmented scene in an urban area can be seen in Figure 3.
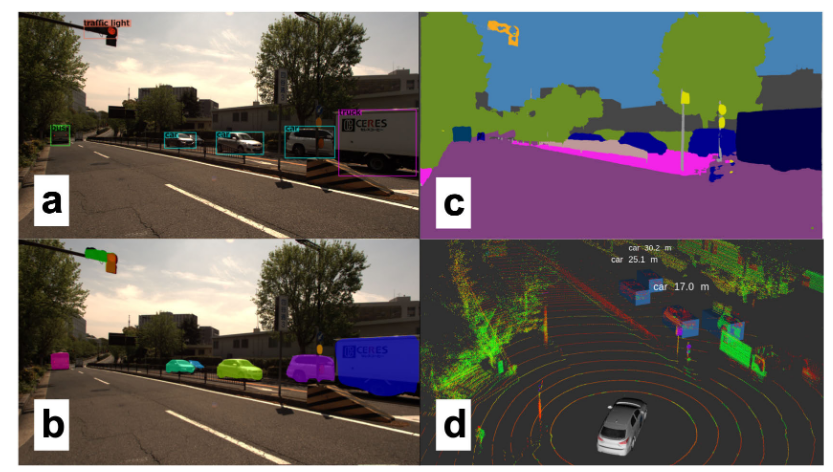
Figure 3. An urban scene near Nagoya University, with camera and lidar data collected by our experimental vehicle and object detection outputs from state-of-the-art perception algorithms. (a) A front facing camera's view, with bounding box results from YOLOv3 and (b) instance segmentation results from MaskRCNN. (c) Semantic segmentation masks produced by DeepLabv3. (d) The 3D Lidar data with object detection results from SECOND. Amongst the four, only the 3D perception algorithm outputs range to detected objects.
Unlike Mask-RCNN’s architecture which is more akin to those used for object detection through its use of region proposal networks, segmentation networks usually employ a combination of convolutions for feature extraction. Those are followed by deconvolutions, also called transposed convolutions, to obtain pixel resolution labels.
1) 3D object detection However, cameras have limitations that are critical to ADS. Aside from illumination which was previously discussed, camera-based object detection occurs in the projected image space and therefore the scale of the scene is unknown.
A relatively new sensing modality, the 3D lidar, offers an alternative for 3D perception. The 3D data collected inherently solves the scale problem, and since they have their own emission source, they are far less dependable on lighting condition, and less susceptible to intemperate weather. The sensing modality collects sparse 3D points representing the surfaces of the scene, as shown in Figure 4.
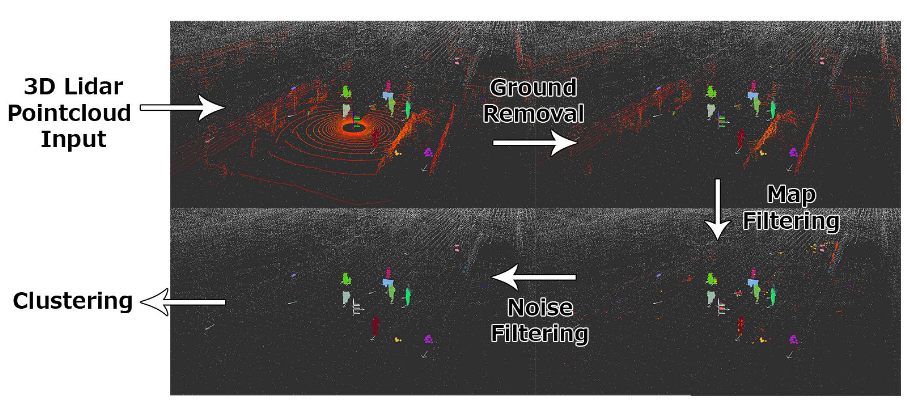
Figure 4. Outline of a traditional method for object detection from 3D pointcloud data. Various filtering and data reduction methods are used first, followed by clustering. The resulting clusters are shown by the different colored points in the 3D lidar data of pedestrians collected by our data collection platform.
Traditional methods often use euclidean clustering or region-growing methods for grouping points into objects. This approach has been made much more robust through various filtering techniques, such as ground filtering and map-based filtering.
Machine learning has also recently taken over 3D detection methods. The first convincing results for point cloud-only 3D bounding box estimation were produced by VoxelNet. VoxelNet learned an encoding from raw point cloud data to voxel grid. Their voxel feature encoder (VFE) uses a fully connected neural network to convert the variable number of points in each occupied voxel to a feature vector of fixed size. SECOND by exploiting the natural sparsity of lidar data.
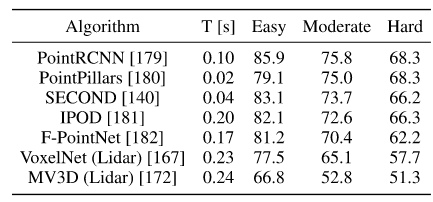
Table 3. Average Precision (AP) in % on the KITTI 3D object detection test set car class, ordered based on moderate category accuracy. These algorithms only use pointcloud data.
Another option for lidar-based perception is 2D projection of point cloud data. There are two main representations of point cloud data in 2D, the first being a so-called depth image shown in Figure 5 left, largely inspired by camera-based methods that perform 3D object detection through depth estimation and methods that operate on RGB-D data.
The other 2D projection that has seen increasing popularity, in part due to the new KITTI benchmark, is projection to bird’s eye view (BV) image. This is a top-view image of point clouds as shown in Figure 5 right. Bird’s eye view images discretize space purely in 2D, so lidar points which vary in height alone occlude each other.
Table 3 shows the leading methods on the KITTI benchmark, alongside detection times. 2D methods are far less computationally expensive, but recent methods that take point sparsity into account are real-time viable and rapidly approaching the accuracy necessary for integration in ADSs.
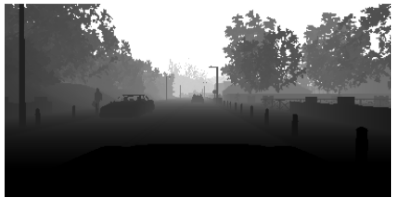
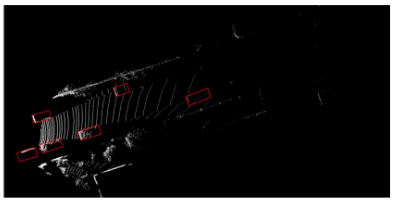
Figure 5. (Left). A depth image produced from synthetic lidar data, generated in the CARLA simulator. (Right). Bird’s eye view perspective of 3D lidar data, a sample from the KITTI dataset.